


Better Bluegrass through Javascript
I like bluegrass for a lot of reasons, but one of the main ones is its communal character: this kind of music is often made as much for the joy of making it as for the sake of the audience. This attitude is especially apparent in bluegrass ‘jams’ – unrehearsed and improvised performances which are endemic to the genre. Bluegrass jams are governed by a rich set of unwritten rules, but the general idea is that a group of musicians (often strangers to one another) sit in a circle and take turns selecting and singing a song (from a standard repertoire), with the rest of the group providing accompaniment and improvised solos. This mode of performance makes for a uniquely ephemeral music experience, but it also introduces a particular set of challenges.
One challenge that has been a particular stumbling block for me is the sheer range of musical keys this process produces. Choosing the key of the song is typically the singer’s prerogative, and most singers will choose whatever key best fits their natural vocal range. This is no problem for guitar and banjo players who can trivially switch between keys using a capo, but as a fiddle player I don’t have the same luxury. I started playing the fiddle relatively recently, and while at this point I’m pretty comfortable in the standard bluegrass keys (that’s G D and sometimes A), when someone calls out a song in the key of G flat, say, then I’m pretty lost.
What I really need is a quick way to look up scales and chords in different keys. I’ve been meaning to dip my toes into javascript- and D3.js-based visualizations for a while now, so in the rest of this post I’ll walk through how I made a quick javascript-based chord / scale visualization tool.
The end goal
Before walking through all the javascript let’s get a feel for what we’re trying to make. This is where we’re headed (click the image to jump to an interactive version):
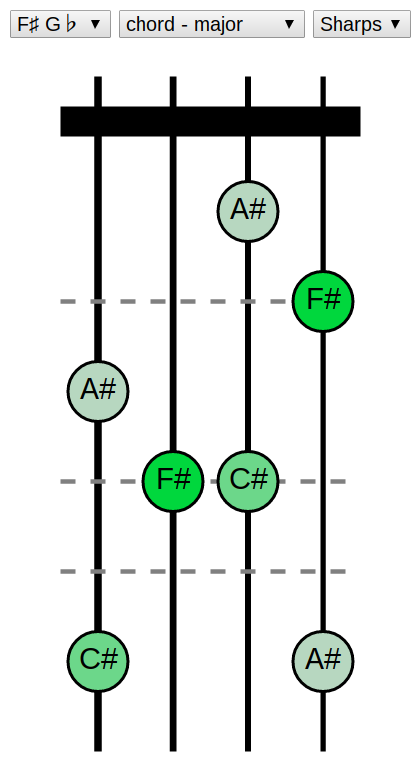
The four vertical lines are the strings on the fiddle, the thick bar at the top represents the top of the fiddle neck, and the horizontal dashed lines correspond to standard finger positions. Each circle is a note in the chord, and the color of the circle corresponds to the degree of the note.
Create the SVG
The first step is to create a SVG to form the base of the eventual chart.
var canvas_w = 250;
var canvas_h = 500;

function createCanvas() {
    // create the svg
    canvas_svg = d3.select("body").select("#canvas")
                                  .append("svg")
                                  .attr("width", canvas_w)
                                  .attr("height", canvas_h);

    // create some groups to hold elements later
    static_g = canvas_svg.append("g").attr("id","svg_static");
    strings_g = static_g.append("g").attr("id","svg_static_strings");
    guides_g = static_g.append("g").attr("id","svg_static_guides");

    notes_g = canvas_svg.append("g").attr("id","svg_notes")

    return canvas_svg
}
At the top level, the SVG contains a couple groups that will hold different elements later; organizing things this way makes styling the eventual chart with CSS much easier.
Draw the static features
The next step is to draw all of the static features in the chart. In this case that means drawing each of the strings, the horizontal bar marking the top of the fiddle neck (called the ‘nut’) and the dashed finger position guides.
First we draw the nut at the top of the fiddle neck.
var canvas_margin = 25;
var nut_h = 20;
var nut_w = canvas_w - 2*canvas_margin
var nut_offset = 30;

function drawNeck(n_strings, guide_sequence) {

    guides_g = d3.select("#svg_static_guides");

    // draw the nut at the top of the neck
    guides_g.append("line")
            .attr("x1", canvas_margin)
            .attr("x2", canvas_margin + nut_w)
            .attr("y1", canvas_margin + nut_offset)
            .attr("y2", canvas_margin + nut_offset)
            .attr("stroke-width", nut_h)
Next we draw each of the dashed finger guides. These guides correspond
to notes which are 2, 4, and 5 musical half-steps above the root note of
the string. For the purposes of this chart each string has seven possible
note positions, so we need to divide the available height into seven equal
steps. This step spacing is stored in the halfstep_spacing variable.
Once we know the spacing we draw a line at each position specified in
guide_sequence. For those of you coming from Python (like me) the last step is
equivalent to [drawGuide(fret) for fret in guide_sequence].
    var halfstep_spacing = (canvas_h - 2*canvas_margin - nut_offset) / 7;

    // draw the finger position guides
    function drawGuide(fret) {
        guides_g.append("line")
                .attr("x1", canvas_margin)
                .attr("x2", canvas_margin + nut_w)
                .attr("y1", canvas_margin + nut_offset + fret*halfstep_spacing)
                .attr("y2", canvas_margin + nut_offset + fret*halfstep_spacing)
                .attr("class", "finger-guide");
    }

    guide_sequence.forEach(drawGuide)
Finally we draw the vertical lines corresponding to the strings.
    // draw the strings
    for (var i = 0; i < n_strings; i++) {

        // space the strings equally, w/ 1/2 spacing at outside edges
        var str_offset = nut_w / n_strings * ( 1/2 + i);

        strings_g.append("line")
                 .attr("x1", canvas_margin + str_offset)
                 .attr("x2", canvas_margin + str_offset)
                 .attr("y1", canvas_margin)
                 .attr("y2", canvas_h - canvas_margin)
                 .attr("stroke-width", 5-i/2)
    }

    return canvas_svg
}
Bind some data to the SVG elements
So far we’ve been drawing static features; next we need to add the dynamic, data-driven elements of the chart, i.e. the notes. To do that we need to come up with a way of representing the different pitches internally; the simplest way I can think of to do this is to number the pitches sequentially, starting with A. This gives us the following mapping:
A     : 0      D# Eb : 6
A# Bb : 1      E     : 7
B     : 2      F     : 8
C     : 3      F# Gb : 9
C# Db : 4      G     : 10
D     : 5      G# Ab : 11
As a first step we’ll associate a root pitch with each string to keep
track of the tuning of the instrument. The code below adds a __data__ attribute
to each svg line tag in the #svg_static_strings group, and then populates the
__data__ attributes with the values in tuning_list.
function setTuning(tuning_list) {
    d3.select("#svg_static_strings").selectAll("line").data(tuning_list)
}

// set the tuning to G D A E
setTuning([10,5,0,7]);
Now that we’re all tuned up we’re ready to draw the actual notes. The first step is to figure out which notes we actually want to play.
function drawNotes(root, chord_shape, sharpflat) {

    // convert the abstract chord_shape (ie maj = [0,4,7]) into a set of
    // notes above a particular root, ie G=10 -> Gmaj = [10, 2, 5]
    to_play = chord_shape.map(function(d) { return (d + root) % 12 });
Here we’re taking a sequence that describes a chord shape (i.e. [0,4,7] representing a chord that contains a root (0) pitch, and pitches that are 4 and 7 half-steps above it) along with a root pitch (i.e. G = 10) and generating a list of the pitches we actually want to play by adding the root pitch to each pitch in the sequence, modulo 12.
Next we remove any notes that have already been drawn.
    // remove any previously existing note circles / text
    notes_g = d3.select("#svg_notes");
    notes_g.selectAll("circle").remove();
    notes_g.selectAll("text").remove();
Now we’re ready to iterate over the strings in #svg_static_strings.
    // draw the notes
    d3.select("#svg_static_strings").selectAll("line").each(function(d, i) {

        this_x = this.x1.baseVal.value;
        this_open_note = this.__data__;

        // get list of notes available on this string
        this_string_notes = range_modulo(12, this_open_note, this_open_note + 7);

        // filter out those not in the desired sequence
        to_draw = this_string_notes.slice().filter(function(n) {
                      return to_play.indexOf(n) != -1
                  });
Above we generate a list of the available pitches on the string, and then filter out those which aren’t in the list of pitches we want to play.
Next we iterate through the notes in to_draw and draw a circle for each one,
using the .data().enter() syntax.
        // append a placeholder <p> tag, otherwise .enter().each() doesn't work
        d3.select(this).selectAll('circle').data(to_draw)
          .enter().append('p').each(function(d,i) {

            finger_pos = this_string_notes.indexOf(d);
            this_y = canvas_margin + nut_offset + halfstep_spacing*finger_pos;

            this_interval = (d - root + 12) % 12

            notes_g.append("circle").attr("r", note_r)
                                    .attr("cx", this_x)
                                    .attr("cy", this_y)
                                    .attr("class", "note degree"+this_interval)
And finally we add a bit of text labelling the note.
            var note_list_sharp = ["A", "A#", "B", "C", "C#", "D",
                                   "D#", "E", "F", "F#", "G", "G#" ];
            var note_list_flat =  ["A", "Bb", "B", "C", "Db", "D",
                                    "Eb", "E", "F", "Gb", "G", "Ab" ];

            // label notes with either sharps or flats
            if (sharpflat == "sharp") {
                note_list = note_list_sharp;
            } else {
                note_list = note_list_flat;
            }

            notes_g.append("text").text(note_list[d])
                                  .attr("x", this_x)
                                  .attr("y", this_y);
        })

    // remove the placeholder <p> tags
    d3.select(this).selectAll('p').remove();

    })
}
And with that we’re practically done. A simple HTML form and some basic CSS and we end up with this. Happy fiddling :)